

Yes. Branding delivers measurable financial returns when it’s tracked against real business KPIs over a multi-year window, not a single quarter. Expect the first measurable lift in 18 to 36 months, with full compounding value showing up over several years as pricing power, lower acquisition costs, and faster deal cycles accumulate.
TL;DR:
- Long-term brand impact usually exceeds short-term sales lift, with measurable benefits starting after 18 to 36 months and compounding over several years.
- Brand strength improves key financial metrics like return on invested capital, gross margin, and average order value by increasing mental availability and reducing price sensitivity.
- Effective measurement requires a mix of tools, including Brand Lift studies, Share of Search, marketing mix modeling, and A/B testing, tracked on different timelines.
- Building a three- to five-year ROI model involves establishing baseline KPIs, translating brand effects into funnel improvements, and projecting cumulative financial returns.
- Prioritize creative quality and strategic measurement planning before increasing media spend to ensure brand investment translates into tangible business results.
Table of Contents
- The ROI of Branding: What the Numbers Actually Show
- How Branding Creates Financial Value: The Mechanisms Behind the Numbers
- How to Measure Brand ROI: The Methods That Actually Hold Up
- Building the Business Case: A 3 to 5 Year ROI Model for Brand Investment
- Turning Brand Strategy Into Measurement: How the Process Works
- Brand Spend vs. Performance Spend: A Practical Framework
- How All City Graphix Helps You Prove Brand ROI
- Sources
- FAQ
The ROI of Branding: What the Numbers Actually Show
Most CMOs already suspect branding works. The problem is proving it to a CFO who wants a payback period, not a feeling. The data exists, and it’s more specific than “brand awareness matters.”
Start with time horizon, because it changes everything about how you should measure. Google’s analysis of long-term versus short-term marketing impact found that sales impact in months 5 through 24 after a campaign typically matches or exceeds the impact in months 0 through 4. That single data point should reframe how you brief finance on brand spend. If you’re only measuring the first quarter, you’re throwing away most of the return.
Then there’s the margin and enterprise-value angle. McKinsey’s research on industrial brands found that companies in the top quartile for visibility growth improved their five-year ROIC by roughly three percentage points more than companies in the bottom quartile. That’s not brand equity as a vague concept. That’s return on invested capital, the metric your CFO already tracks.
Here’s how the mechanics tend to map onto the numbers finance cares about:
- Revenue growth: stronger mental availability drives higher win rates and shorter consideration cycles.
- Margin protection: brand strength reduces price sensitivity, which shows up directly in gross margin.
- Shareholder value: sustained visibility growth correlates with multi-year ROIC gains, which the market prices into valuation.
Key stat: Long-term brand impact matched or exceeded short-term impact in Google’s effectiveness research, with McDonald’s specifically showing 138% long-term relative to short-term sales lift. Any brand ROI model that ignores months 5 through 24 is measuring the wrong window.
How Branding Creates Financial Value: The Mechanisms Behind the Numbers
Branding doesn’t generate revenue by magic. It works through a handful of specific, well-documented mechanisms that show up in your funnel whether you’re tracking them or not.
The first is mental availability: how easily your brand comes to mind when a buyer has a need. Distinctive assets (a color, a logo shape, a jingle, a tone of voice) act as retrieval cues. The easier you are to recall and recognize, the less friction there is between “I need this” and “I’ll buy from them.” That friction reduction is measurable in win rate and time to close.

The second is Extra Share of Voice, or ESOV, paired with creative quality. The IPA’s research on advertising effectiveness makes a case that’s easy to miss: the split between “brand” and “performance” marketing is a false one. Creativity and ESOV act as multipliers on media spend, and brand activity increases the efficiency of performance campaigns rather than competing with them for budget. Weak creative wastes ESOV. Strong creative, according to Think with Google’s measurement research, can account for up to 60% of a digital campaign’s sales effect.
Here’s the direct chain from mechanism to metric:
- Higher mental availability → lower customer acquisition cost, because fewer touchpoints are needed to convert.
- Lower price sensitivity → higher average order value and stronger gross margin.
- Stronger recall and trust → higher win rate and faster sales-cycle velocity.
Pro Tip: Before you increase media budget, audit your creative quality. A stronger brand story with the same spend often beats a bigger budget with mediocre creative.
How to Measure Brand ROI: The Methods That Actually Hold Up
Measuring brand ROI fails most often for one reason: teams pick a single method and expect it to answer every question. No single tool captures both the immediate lift from a campaign and the multi-year compounding effect of consistent brand investment. You need a stack, not a silo.
Here’s how the four core methods break down by what they prove and how fast they deliver an answer:
- Brand Lift studies measure the immediate shift in awareness, consideration, or favorability caused by a specific campaign. Results typically arrive within weeks, making this your fastest read on creative and message effectiveness.
- Share of Search (SoS) tracks your brand’s share of category search demand over time, a practical and repeatable proxy for competitive brand strength that Think with Google’s measurement playbook recommends tracking monthly or quarterly.
- Nested brand-equity marketing mix modeling (MMM) estimates both short-term sales response and the long-term baseline growth that brand investment builds underneath your performance channels. This is the method that captures carryover effects, but it needs 12 or more months of data to stabilize.
- Experiments and A/B tests isolate causality at the campaign or creative level, answering “did this specific change work” rather than “is our brand getting stronger overall.”
McKinsey’s research on brand strength and margin recommends supplementing MMM with A/B testing and multitouch attribution specifically because MMM alone can miss short-term shifts that experiments catch immediately.
For KPIs, track this core set on a consistent cadence:
- Spontaneous (unaided) brand awareness, quarterly
- Consideration and favorability, quarterly
- Share of Search, monthly
- Customer acquisition cost (CAC), monthly
- Lifetime value (LTV), quarterly
- Win rate against named competitors, monthly
| Method | What it proves | Time to insight | Best paired with |
|---|---|---|---|
| Brand Lift | Campaign-level shift in awareness/consideration | Weeks | Creative testing, experiments |
| Share of Search | Competitive demand trend | Monthly | Nested MMM, category trend data |
| Nested brand-equity MMM | Long-term base growth and carryover | 12+ months | Brand Lift, A/B tests |
| Experiments/A-B tests | Causal effect of a specific change | Days to weeks | Brand Lift, MMM validation |
The practical sequence: run Brand Lift and experiments to validate campaign-level causality in the short term, while nested MMM runs continuously in the background to capture the base-effect growth that only shows up after a year or more of data.
Building the Business Case: A 3 to 5 Year ROI Model for Brand Investment
Your board doesn’t want a brand tracker score. It wants a number with a timeline attached. Here’s a reproducible framework, built the way a credible branding business case should be structured: translate brand effects into acquisition cost, deal velocity, win rate, and margin, using your own funnel numbers.
- Establish your baseline. Document current CAC, conversion rate, average order value (AOV), churn rate, and win rate against named competitors. Without a clean baseline, every “lift” claim is unverifiable.
- Map expected KPI lifts to funnel outcomes. If a brand campaign is projected to move spontaneous awareness up 5 percentage points, or Share of Search up 10%, translate that into an estimated conversion-rate improvement and a CAC reduction, using conservative assumptions you can defend line by line.
- Calculate margin impact and cumulative ROI. Multiply the incremental conversions by AOV and margin, then run the model out 3 to 5 years since brand equity compounds rather than delivering flat annual returns.
A simplified sensitivity table looks like this for a company with $10 million in annual revenue and a 25% gross margin:
These figures are illustrative, built to show how the model scales, not a universal benchmark. Run your own with your actual CAC and margin numbers.
When you present this to finance, show your assumptions in the open, not buried in an appendix. Present the sensitivity range instead of a single point estimate, and be explicit that most of the return lands in years two and three rather than the first two quarters. A CFO who sees the range and the reasoning trusts the model far more than one who’s handed a single confident number with no visible math behind it.
Turning Brand Strategy Into Measurement: How the Process Works
Good brand ROI measurement starts before the first design file gets opened. All City Graphix runs every brand engagement through a sequence built for exactly this problem: discovery, strategy, KPI definition, creative execution, measurement, and ongoing optimization.
That process looks like this in practice:
- Discovery: understand the competitive position, audience, and current funnel baseline before anything gets designed.
- Strategy and KPI definition: agree on which brand metrics tie to which commercial outcomes before launch.
- Creative execution: build the distinctive visual assets that drive mental availability.
- Measurement and optimization: set a tracking cadence and revisit the model quarterly as real data replaces assumptions.
Brand Spend vs. Performance Spend: A Practical Framework
Stop treating brand and performance as competing budget lines. Use scale, efficiency, and time horizon to set the mix: smaller or newer brands with low salience should weight toward brand building, since there’s no efficient audience to activate yet. Mature brands defending margin in a crowded category should weight toward protecting distinctiveness. Quick wins either way: test creative quality before adding spend, and run a Brand Lift study on your next campaign instead of guessing at its impact.
— Alex
How All City Graphix Helps You Prove Brand ROI
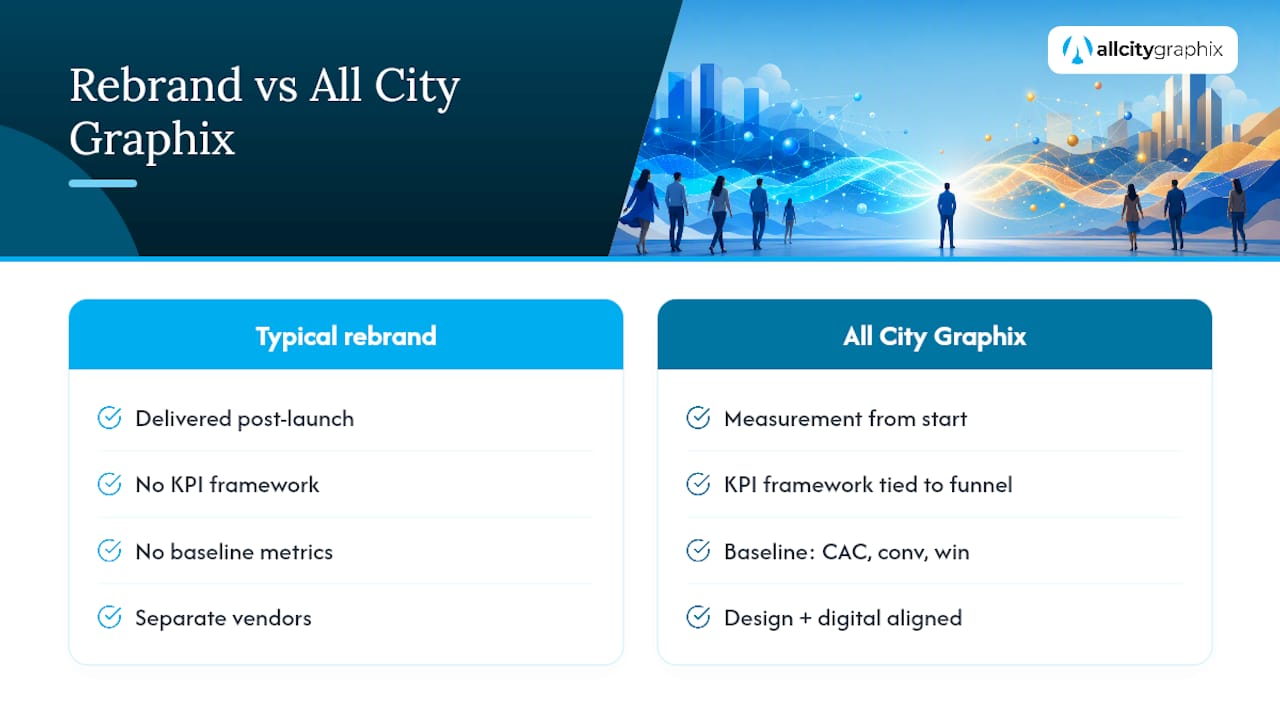
Measurement plans are ideally integrated into brand work from the start, rather than treated as an afterthought bolted on after launch. That’s the real gap between agencies that hand you a logo and one that hands you a KPI framework tied to your funnel from day one.
Where a typical rebrand stops at delivery, All City Graphix’s brand strategy work starts with your baseline CAC, conversion rate, and win rate, then builds the creative and distinctive brand assets designed to move those numbers. The agency’s graphic design and digital execution teams work from the same strategic brief, so your visual identity and your measurement plan are never disconnected pieces built by different vendors on different timelines. For marketing leaders who also want to see how digital spend ties into overall growth, NULLBIT’s breakdown of marketing ROI strategy is a useful companion read.
If you’re heading into a board conversation and need a brand investment case built on real numbers rather than a mood board, request a measurement-ready brief through All City Graphix’s services page and start the discovery conversation this week.
This article is general information, not a substitute for advice from a qualified financial advisor. Consult a qualified financial professional about your own circumstances before acting on anything here.
Sources
- The Effectiveness Equation (Google)
- Profit ability: The new business case for advertising (IPA)
- The rising value of industrial brands (McKinsey)
FAQ
What Is the 3-7-27 Rule in Branding?
The 3-7-27 rule is a rough guideline suggesting it takes about 3 seconds to form a first impression of a brand. It’s a popular mnemonic rather than a peer-reviewed standard, so treat it as a directional heuristic for creative testing, not a hard measurement benchmark.
Is a 1% ROI Good for a Branding Investment?
A 1% return sounds low against a media buy expected to pay back in one quarter, but branding rarely works on that timeline. Because long-term brand impact often matches or exceeds short-term impact over months 5 through 24, a modest early return can still be on track if the model accounts for the full 3 to 5 year compounding window rather than judging it against a 90-day payback.
What Are the Five C’s of Branding?
Definitions vary across the industry, but a common version covers Clarity, Consistency, Constancy, Credibility, and Character, five qualities that determine whether a brand’s identity actually builds the mental availability and trust that drive the financial outcomes covered above.
What Is the 3-3-3 Rule for Marketing?
The 3-3-3 rule generally refers to testing three headlines, three visuals, and three calls to action before scaling a campaign, a quick creative-testing framework rather than a brand measurement standard. It pairs well with running a Brand Lift study on the winning combination before committing full budget.
How Long Does It Take to See Branding ROI?
Expect initial signal within 18 to 36 months, with full compounding value across 3 to 5 years as pricing power and reduced acquisition costs accumulate. Campaign-level Brand Lift results arrive within weeks, but the baseline-growth effects captured by nested MMM need a year or more of data to stabilize.