

To set up Google Analytics, create an account at analytics.google.com, add a GA4 property, create a web data stream, and put the Measurement ID or tag on every page of your site. Then open the Realtime report and confirm your own visit shows up. The whole job takes about 30 minutes on a standard WordPress or Shopify site. The steps below also cover the choices people get wrong: time zone and currency, consent, and checking that data is arriving.
TL;DR
- Create the account and property at analytics.google.com, then add a Web data stream and copy its Measurement ID (it starts with G-).
- Install the tag once, either by pasting the ID into your CMS or by adding the JavaScript snippet to the head of every page. Do not do both.
- Test with the Realtime report, DebugView or Tag Assistant before you trust any number.
- Set your time zone, currency, data retention and consent behavior at the start. Fixing them later is messier.
- Google Analytics is not discontinued. GA4 replaced Universal Analytics, and the old version stopped working in 2024.
Table of Contents
- Before you start: what you need
- Is Google Analytics discontinued?
- Step 1: Create your account and GA4 property
- Step 2: Add a web data stream
- Step 3: Install the tag on your website
- Step 4: Verify that data is arriving
- Step 5: Set privacy and consent options
- Step 6: Turn on what you actually care about
- Step 7: Read your first reports
- Can you set up Google Analytics on any website?
- Our perspective: set up for decisions, not dashboards
- Want it set up without the guesswork?
- Common setup mistakes to avoid
- FAQ
- Sources
Before you start: what you need
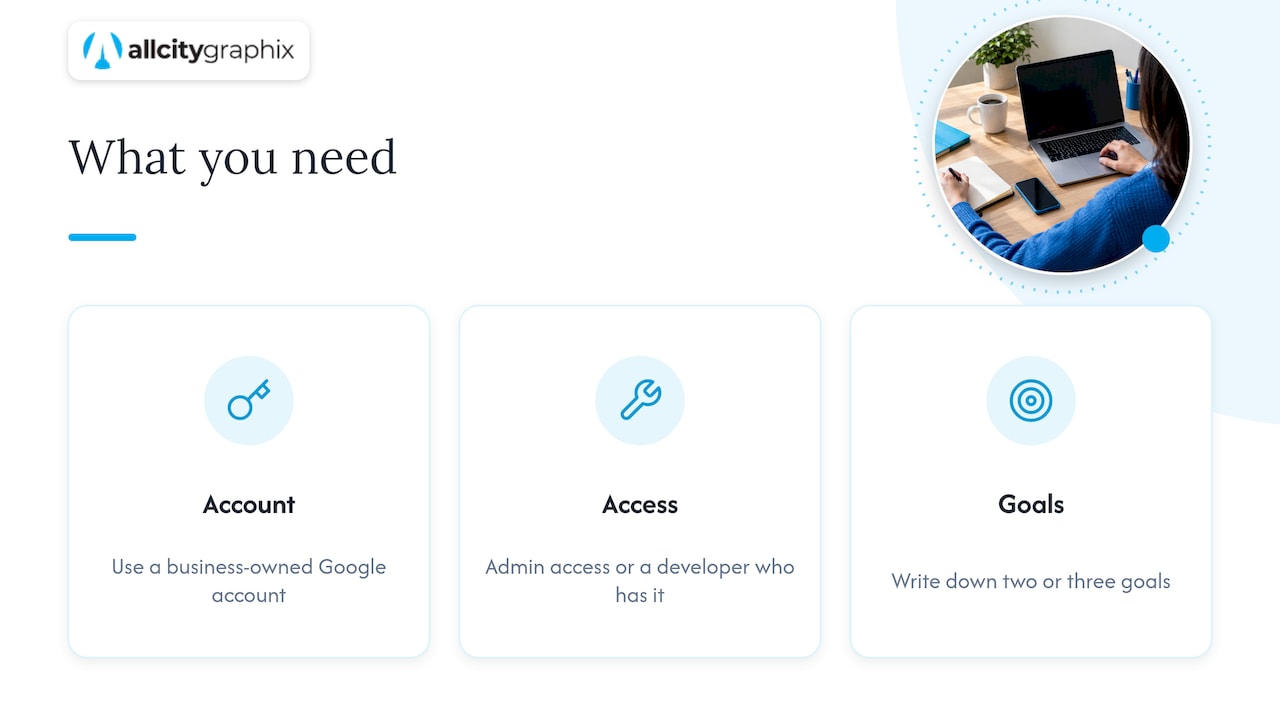
You need three things: a Google account, admin access to your website (or a developer who has it), and a clear idea of what you want to learn. The last one matters more than it sounds. If you can’t say what a visitor should do on your site (call, book, buy, fill out a form), you will end up with a dashboard full of traffic numbers and no answer to “is this working?”
Write down your two or three goals before you click anything. A local service business usually cares about form submissions and phone taps. A store cares about purchases and add-to-cart events. You will use that list in the last section.
Use a Google account that belongs to the business, not a freelancer’s or an ex-employee’s personal address. Ownership of your analytics is a common thing small companies lose when someone leaves.
Is Google Analytics discontinued?
No. What ended was the old version. Google says Universal Analytics was replaced by Google Analytics 4. Standard Universal Analytics properties stopped processing new data on July 1, 2023, and access to the Universal Analytics interface and API ended on July 1, 2024.
So when you see a tutorial about “UA-” tracking codes, skip it. Everything you set up today is GA4, and it identifies itself with a Measurement ID that starts with G-. If you are looking for what replaced the old version, that is it. There is no need to hunt for a third option unless you have a specific reason, such as a regulatory requirement or a need for self-hosted data.
Step 1: Create your account and GA4 property
Google’s own documentation, Set up Analytics for a website and/or app, lays out the path. Here it is in plain terms.
- Go to analytics.google.com, sign in, and click Start measuring.
- Enter an account name. This is the top-level container, usually your company name.
- Review the data-sharing settings shown on this screen. Leave on only what you are comfortable with.
- Click Next to create the property.
If you already have an account and want to add a site to it, go to Admin, choose Create, then Property.
Name, time zone and currency
The property setup asks for a name, a reporting time zone and a currency. Treat these as real decisions:
- Property name: use the site address or brand, such as “allcitygraphixny.com”. If you manage several sites later, clear names save confusion.
- Reporting time zone: pick the zone where your business operates. A New York business should choose Eastern Time so daily totals match the day your team actually lived.
- Currency: choose US dollars if you sell in the US. Revenue reports use it.
You will also be asked about your business size and what you want to measure. These answers shape which reports Google suggests first. They don’t lock you in.
How many properties you need
For most small businesses the answer is one property per website. Google states that an account can hold up to 2,000 properties, so you will not run into the limit. Keep your marketing site and any separate app or store domain in the same property only if you want to see them as one customer journey. Otherwise, give each its own.
Step 2: Add a web data stream
A data stream is the pipe between your site and your property. Without it, nothing is collected.
- In Admin, open Data streams and click Add stream.
- Choose Web.
- Enter your site URL and a stream name.
- Leave Enhanced measurement switched on. It automatically records page views, scrolls, outbound clicks, site search, video engagement and file downloads without extra code.
- Click Create stream.
The stream details page now shows your Measurement ID. Copy it. This is the only code-like item you need for most sites.
Google’s walkthrough confirms the flow: add a stream, pick Web, and copy the Measurement ID from the stream details to install it.
Step 3: Install the tag on your website
This is where most setups go wrong, usually because the tag gets installed twice or not at all. Pick one method.
Option A: Paste the Measurement ID into your CMS
This is the easiest route. Google notes that you can either paste your Measurement ID into your CMS settings or manually insert the JavaScript tag directly after the opening head tag on every page.
For a CMS, look for one of these:
- WordPress: a Google tag or analytics field in your theme or a site-kit style plugin. Paste the G- ID there.
- Shopify: the Google channel or the online store preferences, where a field accepts the Measurement ID.
- Wix, Squarespace and similar builders: a marketing or integrations area with a Google Analytics field.
Save, publish, and move to verification.
Option B: Add the tag manually
In the stream details, open View tag instructions and choose Install manually. Google gives you a short JavaScript snippet. Paste it immediately after the opening head tag on every page you want measured. On a custom site, this usually means a shared header template, so you edit it once.
Option C: Use Google Tag Manager
If you expect to track many things (button clicks, form submissions, ad conversions), a tag manager keeps everything in one container so you don’t touch site code each time. For a first setup on a brochure site, Option A is enough. Move to a tag manager when your tracking list grows.
The double-tag mistake
If your theme, a plugin and a manual snippet all carry the same ID, every page view counts two or three times. Your numbers look great and mean nothing. Before you add the tag anywhere, search your site’s source for “G-” and confirm it appears once.
Step 4: Verify that data is arriving
Do not wait a week to find out something broke. Test right now.
- Open your site in a regular browser window, on a page or two.
- In GA4, open Reports, then Realtime.
- You should see at least one user within a minute or so.
Google’s developer guide on how to verify and troubleshoot your Google Analytics setup lists further checks: the DebugView report, the Tag Assistant browser extension, and the browser’s Network tab, where you look for successful requests to google-analytics.com/g/collect. Analytics Help also notes that standard reports can lag, so Realtime and DebugView are the tools for an immediate answer.
If Realtime stays at zero
Work through this list in order:
- Tag placement: is the snippet in the head of every page, or only the homepage?
- Measurement ID typo: one wrong character sends data nowhere. Compare the ID in your site with the stream details.
- Internal traffic filter: if you have a filter that excludes your own IP address, your test visit disappears by design. Test from your phone on mobile data.
- Browser extensions: ad blockers and privacy tools can block the request. Try a clean browser profile.
- Caching: if you use a caching plugin or a CDN, clear it so the page serving the tag is the new version.
- Consent banner: if the banner blocks analytics until a visitor accepts, accept it first, then test.
The tag-troubleshooting steps above all come from Google’s troubleshooting guide, which names tag placement errors, ID typos, conflicting filters and privacy extensions as the usual causes.
Step 5: Set privacy and consent options
This is the step small businesses skip and later regret. Consent is the business’s job, not Google’s. Google Analytics Help states that you are responsible for obtaining each user’s consent, telling Google about that choice, and making sure Google and third-party tags behave accordingly. A consent banner, a custom solution or a consent-management platform can collect the choice.
There is no single US federal rule that covers every site, and state privacy laws differ in who they apply to. If you serve visitors in California, Connecticut, Texas or elsewhere, ask a privacy attorney which state laws reach your business. Don’t rely on a plugin’s default text.
What Consent Mode does
With Consent Mode, tags that check consent stop storing cookies when a visitor denies it, but they may still send pings that Google Analytics can use to model data. That means your numbers will be less complete than a no-banner site, and that is the honest trade.
Settings worth checking in Admin
The Privacy controls page describes what you can review:
- Data-sharing settings: what you share with Google and its products.
- Google signals: you can switch these off, which limits cross-device and demographic data.
- Granular location and device data: disabling it removes fields such as city and browser minor version from collection.
- Data retention: set how long event-level data is kept in Explorations. Check the available options in your property.
- Linked accounts and services: review which products are connected, such as Google Ads.
If you run ads, note that Google’s tag documentation says setting allow_google_signals to false prevents events from being used for ads personalization and for demographics and interests reporting. Ad personalization also requires the visitor’s ad_personalization consent. Decide with your ads manager whether you want that trade-off.
Step 6: Turn on what you actually care about
A fresh GA4 property tells you who visited. It doesn’t yet tell you who became a customer. Close that gap in the first week.
Mark key events
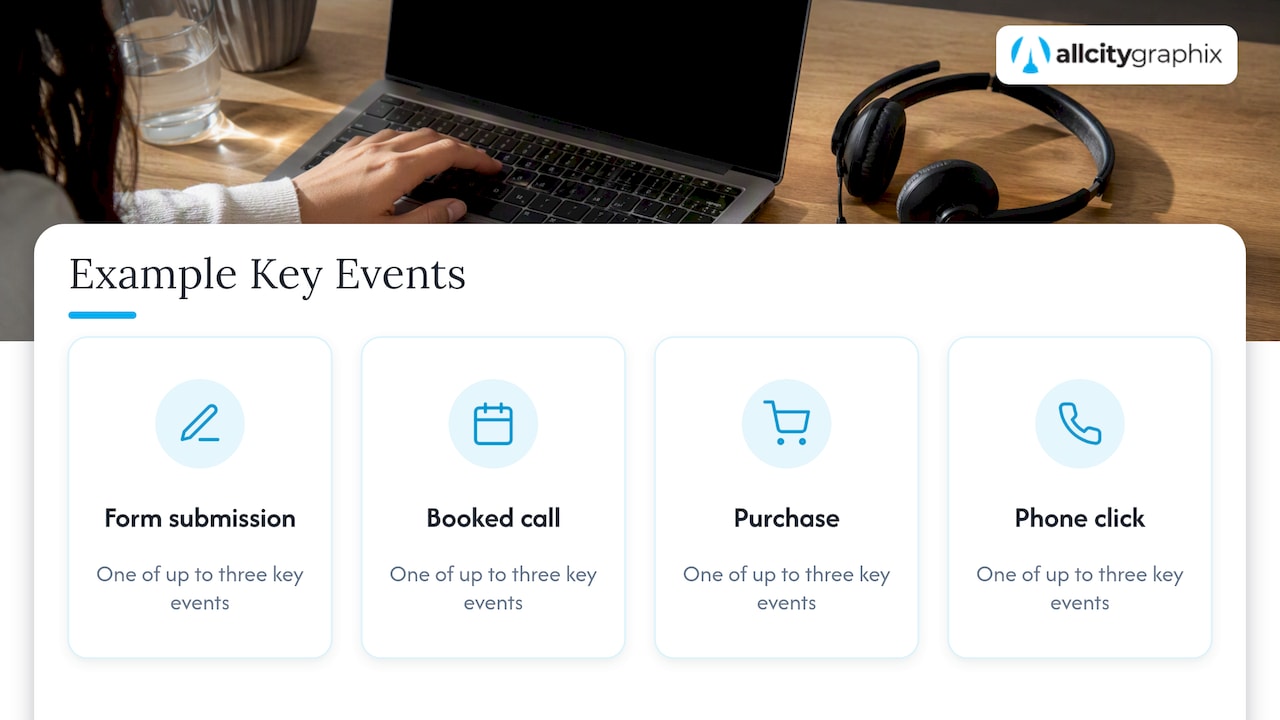
GA4 calls a conversion a “key event.” Choose the actions that matter, such as a form submission, a booked call, a purchase or a click on your phone number. Set them up as events, then mark them as key events in Admin. Start with no more than three. A list of fifteen “important” events means none of them are.
Link Search Console and Google Ads
If you use Google Search Console, link it in Admin so you see which queries brought organic visitors. If you buy ads, link your Google Ads account so campaign data and conversions line up. If you are weighing paid against organic, our piece on shifting budget from Google Ads to SEO shows how to read that data side by side.
Filter out your own traffic
If your team visits the site all day, define internal traffic by IP address and activate the filter. Test it first in its testing state so you do not hide real data by accident.
Give the right people access
In Admin, open Access management and add colleagues or your agency by email with the lowest role that fits their job. Viewers need Viewer. Your marketing lead probably needs Editor. Keep an Administrator who is a real person on your payroll.
Step 7: Read your first reports
Give the property a day or two to collect data, then look at these in order. Google describes the Reports snapshot as the first report in the Reports section and an overview of your property, with templates you can switch between.
| Where to look | The question it answers | What to check first |
|---|---|---|
| Reports snapshot | How is the site doing overall? | Users, new users and key events over the last 28 days |
| Acquisition | Where do visitors come from? | Organic search, direct, referral, social, paid |
| Engagement, Pages and screens | Which pages get attention? | Top pages by views, and whether they match your priorities |
| Engagement, Events | What are visitors doing? | Your key events, and whether counts look plausible |
| Tech overview | What devices do visitors use? | Mobile versus desktop share |
Three habits keep beginners out of trouble:
- Compare periods. One day’s number means little. Compare this month with the last, or this quarter with the same one last year.
- Look at sources and outcomes together. A channel with fewer visits but more form fills may deserve more budget.
- Remember GA4 is sampled and modeled in places. Treat small differences as noise.
If you find that mobile visitors leave quickly, the cause may be speed or layout rather than traffic quality. Our guide on fixing Core Web Vitals explains the metrics that tend to drive this.
Can you set up Google Analytics on any website?
In practice, yes, as long as you can add code or a Measurement ID to your pages. Whether the site is hosted on WordPress, Shopify, a builder or custom code matters only for where you paste the tag. What you can’t do is measure a site you can’t edit, such as a page on someone else’s platform that blocks custom scripts. You also need the right to collect data from the site’s visitors, which is why the consent step above is part of setup rather than an afterthought.
Our perspective: set up for decisions, not dashboards
We’ve built and maintained sites for small businesses and established companies for over 15 years, and the pattern is consistent. The tag usually gets installed. The thinking behind it usually does not.
When we start a project with a discovery meeting, one of the first questions is “what counts as a win on this site?” If the owner can answer in a sentence, analytics setup takes an afternoon. If not, we work on that first, because no tool compensates for an undefined goal.
A few things we’d tell any client:
- Install once, test the same day. The most expensive analytics mistake is months of missing or doubled data that you discover too late to repair.
- Track less, but track it properly. Three key events you trust beat twenty you don’t.
- Tie numbers back to the brand and the page. A conversion rate is a symptom. The cause is often a weak headline, a buried call to action or a slow page. That is where design and measurement meet.
- Know what analytics can’t tell you. It will not show the customer who saw your name on a storefront and searched for you a week later. We cover that limit in our look at why attribution alone falls short, and in our guide to brand awareness metrics.
Good analytics is a loop: measure, change something on the site, measure again. Setup is just the first turn.
— Alex
Want it set up without the guesswork?
If you’d rather hand this off, we build and maintain WordPress and Shopify sites, and measurement setup is part of how we launch them. We work with you to define what success looks like, configure tracking to match, and stay on after launch to review results. See what we offer on our services page, or get in touch about web design if your site needs a rebuild before you measure it.
Common setup mistakes to avoid
- Installing the tag twice through a plugin and a manual snippet.
- Leaving the wrong time zone or currency, which skews daily and revenue reports.
- Never checking Realtime after launch.
- Counting your own visits, which inflates small-site traffic sharply.
- Skipping consent, then discovering the site has been collecting data under rules you did not meet.
- Giving admin access to people who have left the company or an agency you no longer use.
- Tracking everything and acting on nothing.
If organic search is your main channel, pair your analytics with a local plan. Our SEO guide for small businesses and the Google Business Profile checklist give you something concrete to measure against.
FAQ
How long does a Google Analytics setup take?
About 30 minutes for the account, property, data stream and tag on a standard CMS site. Add time for a consent banner, key events and linking Google Ads or Search Console. A custom site or a store with purchase tracking can take a few hours.
How long until I see data in GA4?
Realtime shows visits within a minute or two if the tag is working. Standard reports can take longer to populate, so use Realtime or DebugView to confirm the setup the same day, and give the other reports a day or so.
Is Google Analytics free?
Yes for most small businesses. Google describes the standard product as free of charge. A paid enterprise tier exists, but a typical small-business site doesn’t need it.
Do I need a developer to install GA4?
Not usually. If your CMS has a field for the Measurement ID, you can do it yourself. You’d want a developer for custom e-commerce events, a tag manager setup, or a site where you can’t edit templates.
Sources
- Set up Analytics for a website and/or app, Analytics Help
- Verify and troubleshoot your Google Analytics setup, Google for Developers
- Introduction to user consent management, Analytics Help
- Privacy controls in Google Analytics, Analytics Help
- Manage privacy settings, Google Tag Platform
- Google Analytics 4 has replaced Universal Analytics, Analytics Help
- Reports snapshot, Analytics Help
- Analytics tools and solutions, Google Marketing Platform