

Core Web Vitals are three field metrics, LCP, INP, and CLS, and Google treats them as ranking signals that reward pages meeting “good” thresholds at the 75th percentile. Your first move is opening Search Console’s Core Web Vitals report seeing which URL groups are flagged Poor or Needs Improvement, then work the fixes in order: server response time, loading, interactivity, then visual stability.
TL;DR:
- Improving server response time and reducing load delays should be prioritized before fixing interactivity and visual stability issues.
- Fixes that target critical metrics like TTFB and LCP typically show lab improvements within minutes but take weeks to reflect in search rankings.
- Focusing solely on INP and CLS without addressing slow server responses or large images often leads to ineffective, misaligned optimizations.
- Real user monitoring and immediate lab testing are essential for early validation, as Search Console updates can take up to six weeks.
- Targeting the 75th percentile score, rather than perfect lab metrics, ensures fixes address real user experience and impact search performance.
Table of Contents
- What Do LCP, INP, and CLS Actually Measure?
- Do Core Web Vitals Actually Affect Rankings?
- How Do You Measure Core Web Vitals Correctly?
- Which Core Web Vitals Fix Should You Tackle First?
- How Do You Debug Each Metric in Practice?
- Agency Playbook: Auditing and Fixing Core Web Vitals
- How Do You Verify a Core Web Vitals Fix Actually Worked?
- What the Conventional Core Web Vitals Advice Gets Wrong
- Get Your Core Web Vitals Fixed Without the Guesswork
- Sources
- FAQ
What Do LCP, INP, and CLS Actually Measure?
Each metric captures a different failure mode, and mixing them up wastes debugging time. Largest Contentful Paint (LCP) tracks how long it takes the biggest visible element, usually a hero image or a large headline block, to render. Interaction to Next Paint (INP) replaced First Input Delay in March 2024 because FID only measured the delay before an interaction started, while INP measures the full time from click to visual response, including the worst interaction on the page rather than just the first. Cumulative Layout Shift (CLS) adds up every unexpected movement of visible elements, the classic case being a button that jumps down the page because an ad slot above it just loaded.
The official thresholds that separate “good” from “needs work” are:
- LCP: 2.5 seconds or less is good; over 4 seconds is poor
- INP: 200 milliseconds or less is good; over 500 milliseconds is poor
- CLS: a score of 0.1 or less is good; above 0.25 is poor
Every one of these gets scored at the 75th percentile of real visits over a rolling 28-day window, meaning one in four of your visitors can have a worse experience than your reported score and you’ll still pass. That’s a deliberate design choice: it filters out one freak slow connection while still holding you accountable for the bulk of your traffic.
Do Core Web Vitals Actually Affect Rankings?
Yes, but not the way most SEO content implies. Google has been explicit that good Core Web Vitals support success in Search as part of page experience, and the company has also cautioned against obsessing over a perfect score instead of real user experience gains. CWV works primarily as a tiebreaker: when two pages match on relevance and content quality, the faster, more stable one edges ahead.
The business case is stronger than the ranking case. Faster, more stable pages lift click-through and conversion rates while cutting bounce, and that payoff compounds on mobile-first, transactional pages, think checkout flows, lead forms, booking pages, where every extra second of load time gives a visitor one more reason to leave.
How Do You Measure Core Web Vitals Correctly?
You need two different data types, and confusing them leads to false confidence. Field data comes from real visitors through the Chrome User Experience Report (CrUX), Search Console, or your own Real User Monitoring (RUM) setup, and it’s what Google actually uses for ranking. Lab data, generated by Lighthouse or PageSpeed Insights on a single simulated run, is great for debugging but can look nothing like your real-world numbers if your actual traffic skews toward older phones or slower connections.
Here’s the toolkit and what each one is for:
- Search Console’s Core Web Vitals report groups your URLs by status using CrUX field data, and it assigns each group the status of its worst metric, so one bad CLS score can drag an otherwise fast page into the “Poor” bucket.
- PageSpeed Insights blends both field and lab data in a single report, which makes it the fastest way to sanity check a page before and after a fix.
- The web-vitals JavaScript library lets you log real INP and CLS events straight from your own visitors, which matters because Chrome DevTools alone can’t replicate every user’s device or network.
- DevTools Performance panel and WebPageTest dig into the actual timeline: what loaded when, which script blocked the main thread, and which element caused the shift.
One catch worth knowing: pages with too little traffic simply won’t appear in Search Console’s report at all, since CrUX needs a minimum sample size to publish a score.
Which Core Web Vitals Fix Should You Tackle First?
Work in this order, because each layer depends on the one before it: TTFB, then LCP, then INP, then CLS, a sequence web.dev itself recommends. Fixing LCP before your server responds quickly is like polishing a car engine that won’t start.
Time to First Byte is your diagnostic starting point. Check your hosting tier, confirm a CDN is actually caching your HTML, and look for database queries running on every request that could be cached instead. A performance-oriented hosting provider can shave hundreds of milliseconds off TTFB before you touch a line of front-end code.
LCP quick wins, usually the frontend team’s job:
- Preload the hero image with
fetchpriority="high"instead of leaving the browser to discover it late - Convert images to AVIF or WebP, which routinely cut file size by half or more
- Never lazy-load the LCP image itself, since that delays its discovery
- Make sure the image URL sits in the HTML markup, not injected later by JavaScript
INP quick wins: defer non-critical scripts, break long tasks into smaller chunks, and audit event handlers that do heavy work synchronously on click or scroll.
CLS quick wins: add explicit width and height to every image and embed, reserve fixed-size boxes for ads before they load, and choose a font-loading strategy that doesn’t cause a jarring reflow.
Pro Tip: Assign TTFB and LCP fixes to whoever owns hosting and build pipelines, and hand INP and CLS to frontend developers, since the skill sets rarely overlap and mixing them up slows the whole sprint down.
How Do You Debug Each Metric in Practice?
Fixing these metrics for real means decomposing them, not just staring at a single score.
LCP breaks into four phases: TTFB, resource discovery, resource load time, and render delay. Open DevTools’ Performance panel, record a page load, and check whether your LCP image loads late because it’s buried in a JavaScript bundle rather than sitting in the initial HTML. A CSS background-image used for a hero element often gets missed entirely by LCP detection, so switch it to an actual <img> tag when the image is the main content.

INP is the trickiest, because it grades your single worst interaction rather than an average. Locating the offending handler requires recording a real click or tap in DevTools and looking for long tasks on the main thread. Once found, split the work: use scheduler.yield() where supported, or fall back to setTimeout to hand control back to the browser between chunks of a heavy function.
CLS is the easiest to catch visually. DevTools’ Layout Shift regions highlight exactly which element moved and by how much. Give images and video an explicit width and height, apply aspect-ratio in CSS for responsive containers, and reserve placeholder boxes for ads and iframes before they load.
| Metric | Root cause to check first | Fix that moves the needle |
|---|---|---|
| LCP | Image loaded via JS, not in HTML | Preload + fetchpriority="high" |
| INP | Long synchronous task on click | Chunk work with scheduler.yield() |
| CLS | No reserved space for late content | Explicit width/height, aspect-ratio |
A successful fix shows up in the lab within minutes, but the real proof is a lower p75 in Search Console two to six weeks later.
Agency Playbook: Auditing and Fixing Core Web Vitals
Allcitygraphixny runs Core Web Vitals work as a four-step cycle: audit the current CrUX and lab data, rank issues by traffic impact, implement fixes in the TTFB to CLS order, then monitor. Lab improvements show up the same day; CrUX and Search Console typically reflect the change two to six weeks later once enough visits roll through the 28 day window.
Handling this in-house works fine for a single landing page. It gets riskier on a site with complex JavaScript frameworks, multiple ad partners, or a redesign in progress, where one wrong dependency change can undo a fix elsewhere. That’s usually the point to bring in outside web design support rather than debug it live in production.
How Do You Verify a Core Web Vitals Fix Actually Worked?
Don’t wait a month to find out if a fix worked; there’s a faster path. Because CrUX reports on a rolling 28 day window, Search Console usually needs two to six weeks to reflect any change you make, so real-user monitoring is your short-term signal while you wait.
- Run a fresh lab test immediately after deploying, using PageSpeed Insights or Lighthouse, to confirm the change did what you expected.
- Track the RUM delta with the web-vitals JS library before and after, comparing the same URL group over a matched time window.
- Recheck Search Console’s p75 figure two to six weeks out, since that’s the number Google actually uses for scoring.
- Watch engagement metrics, bounce rate and conversion rate, alongside the score, since a passing metric that doesn’t move business numbers is a signal your fix targeted the wrong page.
Ranking or conversion movement tends to lag the score itself, since Google needs to recrawl and re-evaluate before any tiebreaker effect kicks in.
What the Conventional Core Web Vitals Advice Gets Wrong
Most Core Web Vitals content treats the three metrics as equally urgent, and that’s the biggest tactical error I see teams make. INP and CLS fixes are worthless if your TTFB is sitting at 1.8 seconds because of an unoptimized database query. Fix the foundation first, or you’re rearranging furniture in a house that’s still on fire.
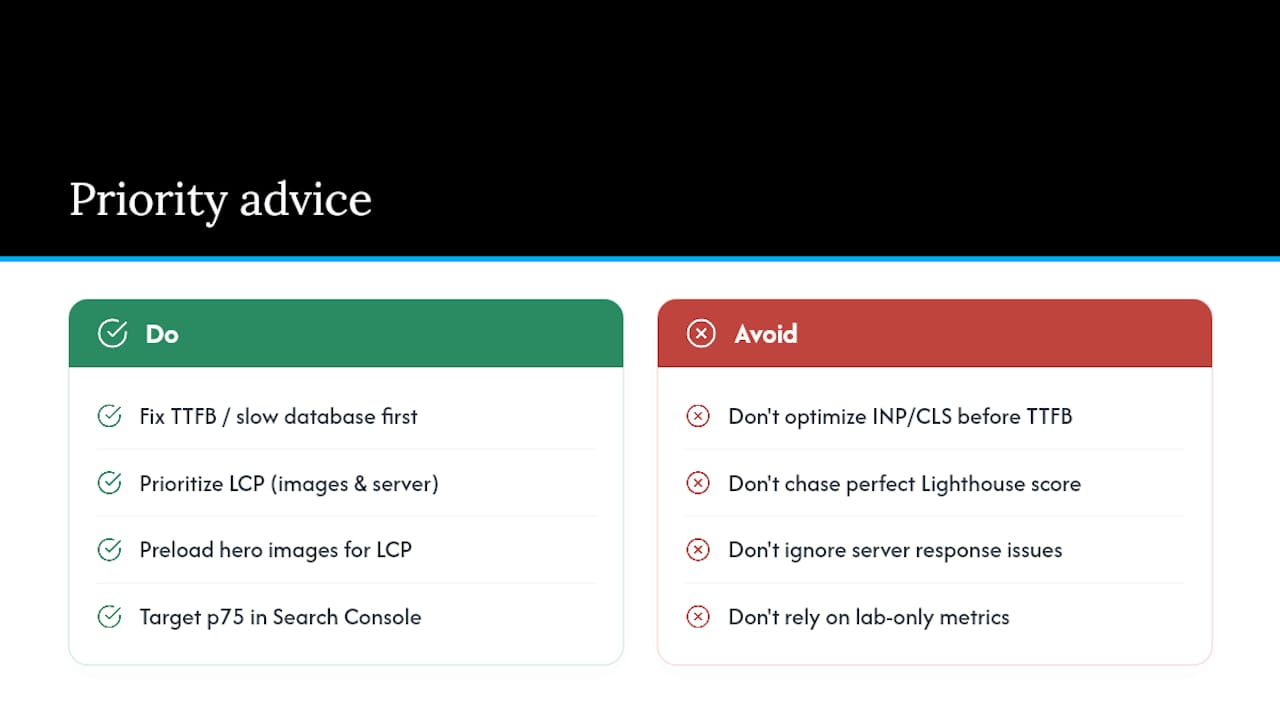
The second thing conventional advice underplays: LCP failures dominate site-wide Core Web Vitals reports far more than INP or CLS issues do, largely because image discoverability and server response time are the easiest things to get wrong and the easiest to overlook. Teams spend hours micro-optimizing JavaScript for INP while a single unpreloaded hero image is quietly failing LCP for three-quarters of their visitors.
What I’d tell any team starting from zero: don’t chase a perfect Lighthouse score. Chase the p75 number in Search Console, because that’s tied to real visitors and real ranking behavior, and it’s the only number that moves the needle on both search performance and conversions. A 95 in a lab test that doesn’t reflect your actual mobile traffic is a vanity metric, not a fix.
— Alex
Get Your Core Web Vitals Fixed Without the Guesswork
Fixing Core Web Vitals in-house works until it doesn’t, usually right when a redesign, a new ad script, or a framework migration quietly undoes six months of careful tuning. Allcitygraphixny builds performance into the web design process itself rather than bolting it on afterward, which means fewer regressions to chase down later and a shorter path from broken score to fixed one.

The team runs the same audit, prioritize, implement, monitor cycle described above on real client sites, and pairs it with RUM setup so you’re not stuck waiting a full month to know if a change worked. That matters most on high-value pages like construction industry sites where a slow load directly costs leads, or transactional pages where every second of delay chips away at conversions. If your Search Console report shows a wall of red or yellow URL groups and you’d rather not spend a quarter chasing it solo, reach out to Allcitygraphixny and get a scoped plan for what to fix first.
Sources
- Web
- Understanding Core Web Vitals and Google search results
- Core Web Vitals report – Search Console Help
FAQ
What Are Core Web Vitals?
Core Web Vitals are three Google metrics, Largest Contentful Paint, Interaction to Next Paint, and Cumulative Layout Shift, that measure loading speed, responsiveness, and visual stability, scored at the 75th percentile of real user visits.
Are Core Web Vitals Still Relevant for SEO?
Yes. Google continues to use them as part of page experience and a ranking tiebreaker, and they remain directly tied to real conversion and bounce-rate outcomes regardless of any ranking impact.
What Counts as a Good Core Web Vitals Score?
A good score means LCP at 2.5 seconds or under, INP at 200 milliseconds or under, and CLS at 0.1 or under, all measured at the 75th percentile across a 28 day period.
How Do I Pass the Core Web Vitals Assessment?
Fix issues in priority order: diagnose slow server response time first, then optimize your largest visible element, then reduce JavaScript blocking interactions, then reserve layout space to eliminate shifts. Working out of that order usually wastes effort on metrics that depend on earlier fixes.
How Long Until a Fix Shows Up in Search Console?
Expect two to six weeks, since Search Console relies on a rolling 28 day CrUX window. Use real user monitoring in the meantime to confirm a fix worked before the official score catches up.